How this course works

Anatomy before technology

Every number on a hemodynamic monitor describes something physical: a node that fires, a chamber that fills, a valve that opens, an artery that tightens. If you can point to the place, the number stops being abstract.

Each lesson has one big idea, one drawing or chart, a few key points, a bedside note and a short self-check. The drawings are simplified on purpose. When you finish, the Technology page shows how Electrical Cardiometry measures what you have just learned.

By the end you can

  1. Point to the heart, lungs, great vessels and diaphragm on a chest picture.
  2. Trace one drop of blood through both pumps and all four valves.
  3. Explain stroke volume with three levers: preload, contractility, afterload.
  4. Tell flow from pressure, and work out CO, MAP and SVR.
  5. Say why stroke volume swings with ventilator breaths, and when that matters.
  6. Name the place where each parameter on the monitor is made.
Lesson 1 · The chest map

One box holds the pump, the lungs and the pipes

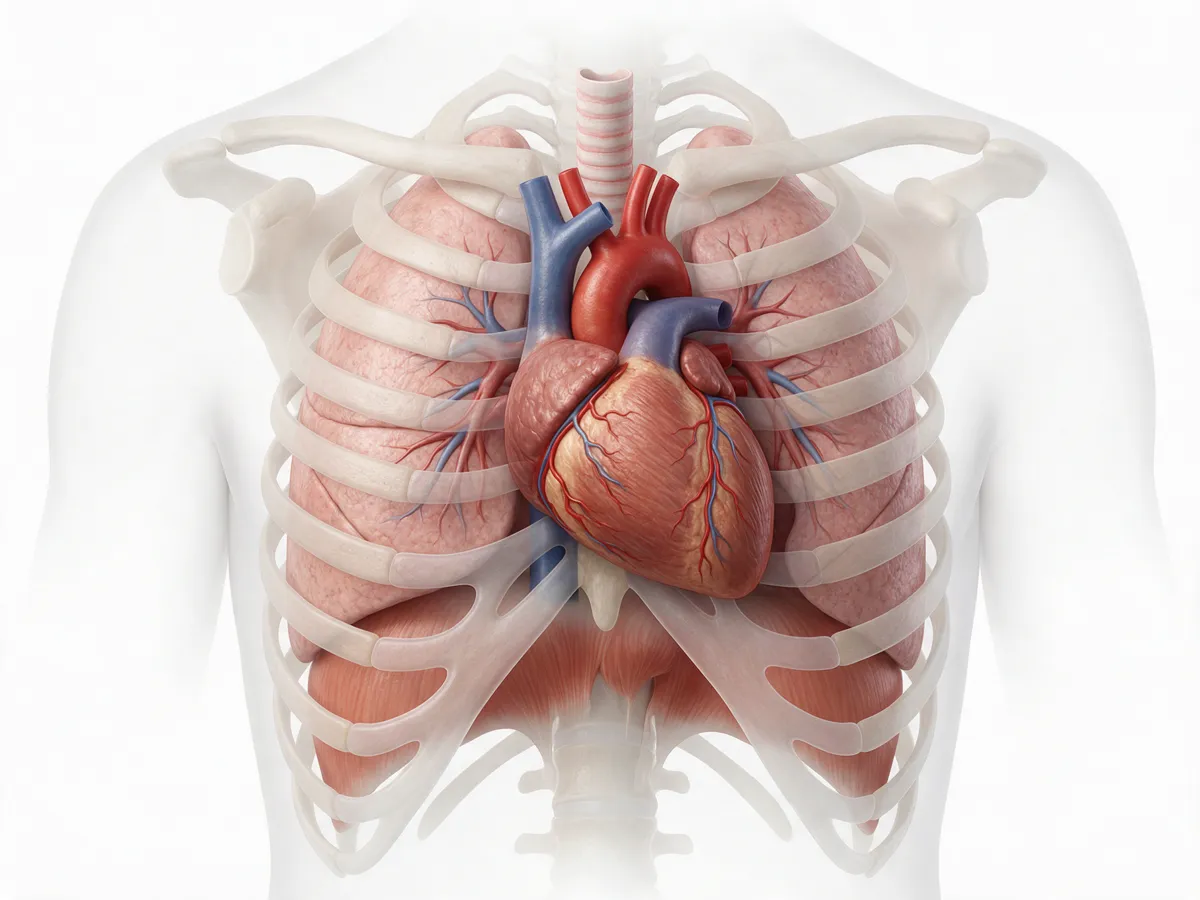
The heart sits in the middle of the chest, between the two lungs and on top of the diaphragm, with the great veins bringing blood in and the aorta taking it out.

Illustration of the chest from the front: rib cage and collarbones, both lungs, the heart in the middle with the aortic arch and the superior vena cava above it, the inferior vena cava below it, and the dome-shaped diaphragm forming the floor.
Front view: the patient's right is on your left. AI-generated teaching illustration (Magnific); artistic, not an anatomical reference.
  1. The middle compartment of the chest, behind the breastbone. About two-thirds of the heart lies left of the midline, apex pointing down and to the left. It sits in a tough sac, the pericardium: fluid or blood in that sac (tamponade) squeezes the heart and stops it filling.

  2. Fill most of the chest on both sides. Every drop the right heart pumps passes through them. Their pressure swings with each breath reach the heart and the great veins (Lesson 6).

  3. Leaves the left ventricle, rises, arches over to the left (branches to the head and arms), then runs down behind the heart beside the spine as the descending thoracic aorta, through the diaphragm into the abdomen.

  4. Brings blood from the head, neck and arms into the right atrium. The pressure here and in the right atrium is the central venous pressure (CVP).

  5. Brings blood from everything below the diaphragm up into the right atrium. Together the two venae cavae carry the venous return that fills the heart.

  6. The main breathing muscle and the floor of the chest. When you breathe in on your own it moves down and the pressure in the chest falls, which helps blood flow back to the heart. A ventilator breath pushes chest pressure up instead.

Why the chest matters for Electrical Cardiometry. The monitor's tiny current runs along the thorax, from sensors at the base of the neck to sensors at the lower ribs, and the descending thoracic aorta lies along that path. The method models its beat-by-beat signal on accelerating aortic flow; everything else in the chest that conducts, mostly fluid, sets the baseline (Lesson 7).

Why it matters at the bedside

Anything that crowds the chest can stop the heart filling: fluid in the pericardium (tamponade), air under pressure in the pleura (tension pneumothorax), very high airway pressures. The heart is fine; it simply cannot fill. That is obstructive shock, and the numbers look like an empty tank.

Check yourself

Which vessel brings blood from the legs and abdomen back to the heart?

The inferior vena cava. It passes up through the diaphragm into the right atrium.

Where does the aorta go after the arch?

Down behind the heart, beside the spine, as the descending thoracic aorta, and on through the diaphragm into the abdomen.

Why can tamponade cause shock in a normal heart?

Fluid in the pericardial sac squeezes the heart from outside, so it cannot fill. No filling, no stroke volume.

Read more: OpenStax A&P 2e, 19.1 Heart Anatomy · NHLBI: What the heart looks like

Lesson 2 · The heart

Two pumps, four chambers, four valves

The heart is two pumps side by side: the right pumps blood through the lungs, the left pumps it round the body, one after the other in a single closed loop.

The circulation: two pumps in series Oxygen-poor blood from the body returns in the venae cavae to the right atrium, passes the tricuspid valve into the right ventricle, and is pumped through the pulmonary valve into the pulmonary artery and the lungs. Oxygen-rich blood returns in the pulmonary veins to the left atrium, passes the mitral valve into the left ventricle, and is pumped through the aortic valve into the aorta and on to the body, then back to the veins. Lungs pick up O₂ · drop CO₂ Body organs use O₂ RA right atrium LA left atrium RV right ventricle thin wall · low pressure LV left ventricle thick wall · high pressure Tricuspid Mitral Pulmonary valve Aortic valve Pulmonaryartery Pulmonaryveins Aorta Venaecavae
  • Oxygen-poor blood
  • Oxygen-rich blood
  • Valve: opens one way only
Schematic, not to scale. The right heart is drawn on the left, as you see it facing the patient.
  • Two pumps in series. Right heart → lungs → left heart → body → back. Each beat, both ventricles eject at the same time.
  • Four chambers. The atria are small receiving rooms; the ventricles are the pumps.
  • Four valves, all one-way: tricuspid and pulmonary on the right, mitral and aortic on the left. They are what keeps the loop moving forward.
  • The left ventricle is the muscular one. It pumps against the high pressure of the whole body; the right only has to push through the low-pressure lungs, a soft sponge between the two pumps.
  • Over time, both pumps must move the same amount. If one pump fails, blood backs up behind it: left failure → lungs (pulmonary oedema); right failure → body (raised venous pressure, swollen legs and liver).
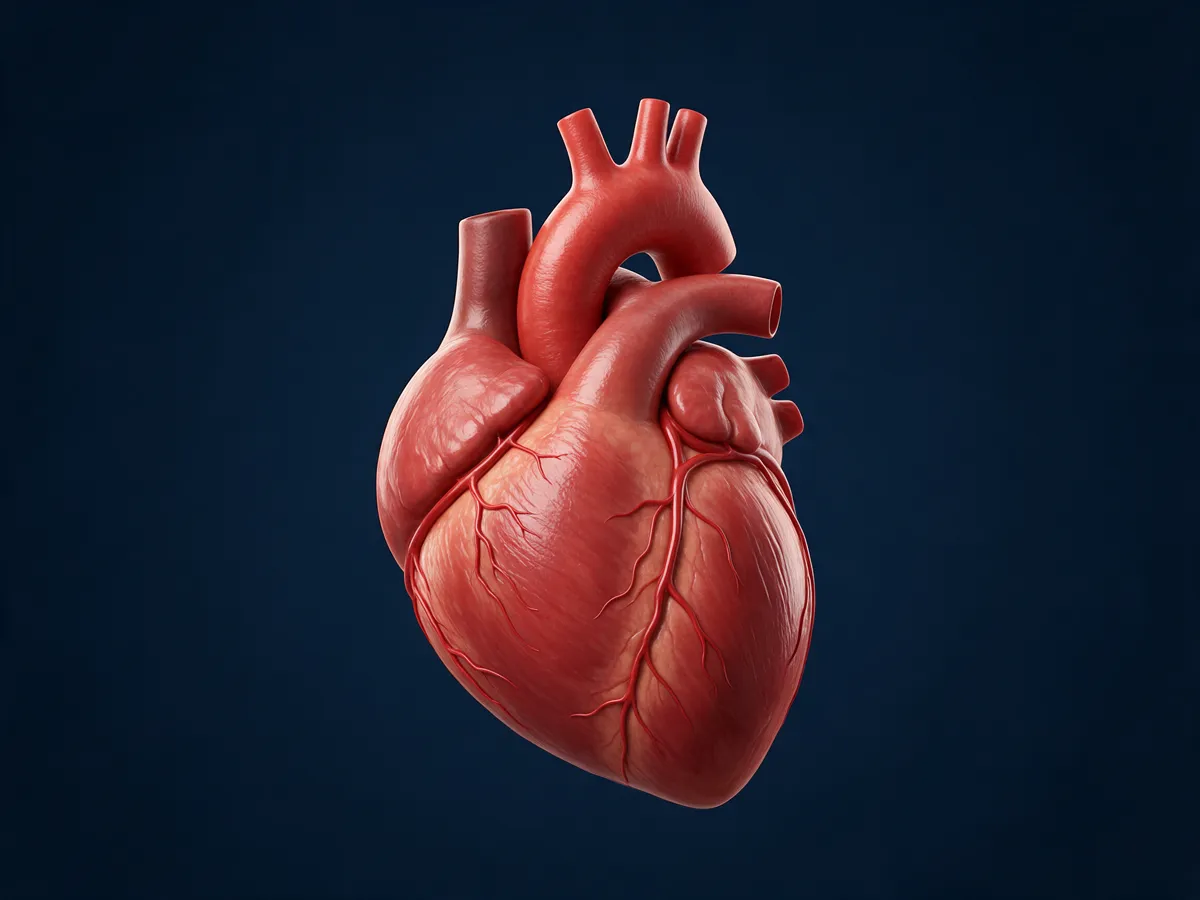
Illustration of the human heart from the front, with the aortic arch and its three branches above it and coronary arteries on its surface.
The real thing, from the front: the aortic arch and its branches on top. AI-generated teaching illustration (Magnific); artistic, not an anatomical reference.

Why it matters at the bedside

When a monitor reports stroke volume, it means the blood leaving the left ventricle into the aorta. The "backing up" rule explains the pictures you see: a failing left ventricle wets the lungs (crackles, hypoxia, a rising thoracic fluid content); a failing right ventricle raises the CVP and swells the liver and legs.

Check yourself

Which chamber pumps blood into the aorta, and through which valve?

The left ventricle, through the aortic valve.

Which chamber pumps blood to the lungs?

The right ventricle, through the pulmonary valve into the pulmonary artery.

Do arteries always carry oxygen-rich blood?

No. Arteries carry blood away from the heart. The pulmonary artery carries oxygen-poor blood to the lungs, and the pulmonary veins bring oxygen-rich blood back.

The left ventricle suddenly weakens. Where does fluid collect first?

In the lungs, behind the failing pump: pulmonary congestion and, if severe, pulmonary oedema.

Read more: NHLBI: How blood flows through the heart · OpenStax A&P 2e, 19.1 Heart Anatomy

Lesson 3 · One heartbeat

A spark, then a squeeze, then a refill

Every beat starts as an electrical signal; a moment later the ventricle squeezes, the valves open and shut, and the ventricle empties and refills.

One beat, left ventricle

ECG, valve events and left-ventricular volume over one heartbeat The QRS complex comes first. Then the mitral valve closes (1) and, a moment later, the aortic valve opens (2): the left ventricle ejects and its volume falls from end-diastolic to end-systolic volume. The aortic valve closes (3) near the end of the T wave, the mitral valve opens (4), and the ventricle refills, with a final top-up from the atrial contraction after the P wave. The difference between the highest and lowest volume is the stroke volume. systole: squeeze diastole: fill ECG P QRS T LV volume end-diastolic volume (EDV) end-systolic volume (ESV) stroke volume = EDV − ESV atrial kick 1 2 3 4 time → one beat at 75 per minute lasts 0.8 s
  1. 1
    Mitral valve closes: the ventricle starts to squeeze, both valves shut for a moment.
  2. 2
    Aortic valve opens: ejection begins (point B on the Electrical Cardiometry waveform).
  3. 3
    Aortic valve closes: ejection ends (point X).
  4. 4
    Mitral valve opens: the ventricle refills, fast at first, then slowly, then the atrium tops it up.
Teaching illustration, not to scale. The shaded pink band is ejection.
  • The spark: the sinoatrial (SA) node, a small patch of tissue in the wall of the right atrium, fires on its own. Its rate is the heart rate, tuned up or down by nerves and hormones.
  • The pause: the AV node holds the signal for a fraction of a second so the atria can top up the ventricles, then passes it down the septum and through the ventricles.
  • The squeeze (systole) follows the QRS. Only when ventricular pressure beats aortic pressure does the aortic valve open and blood leave.
  • The refill (diastole) takes most of each beat at rest. As the rate rises, diastole shortens much more than systole, so a very fast heart has little time to fill.
  • Stroke volume = EDV − ESV: what was in the ventricle at the end of filling, minus what is left after the squeeze.
The conduction system: SA node in the right atrium, AV node, bundle in the septum, branches to both ventricles SA node AV node bundle branches RALA RVLV
Simplified conduction pathway. Schematic, not to scale.

Why it matters at the bedside

Heart rate has an address: the SA node. A faster rate raises output only up to a point; in a fast tachycardia or atrial fibrillation the ventricle loses filling time and its atrial top-up, and stroke volume falls. Electrical Cardiometry times every beat against the ECG and reads valve opening (B) and closing (X) from its waveform, which gives the ejection time.

Check yourself

Where does a normal heartbeat start?

In the sinoatrial (SA) node, in the wall of the right atrium.

EDV 120 mL, ESV 50 mL. What is the stroke volume?

70 mL (120 − 50).

The heart rate doubles. Which phase of the beat shortens most?

Diastole, the filling phase. That is why very fast rates can reduce stroke volume.

Read more: NHLBI: How the heart beats · OpenStax 19.2 Cardiac Muscle and Electrical Activity · OpenStax 19.3 Cardiac Cycle

Lesson 4 · Stroke volume

Three levers: preload, contractility, afterload

How much blood leaves with each beat depends on three things: how full the ventricle is before it squeezes, how strongly it squeezes, and what it has to push against.

Think of a slingshot

Slingshot analogy for the three levers of stroke volume Preload is how far the band is pulled back before release. Contractility is how strong the band itself is. Afterload is the headwind and the stiff door the stone must push through. The stone in flight is the stroke volume. 1 Preload how far it is pulled back (stretch at the end of filling) 2 Contractility how strong the band is, whatever the stretch stroke volume 3 Afterload the headwind it flies into: aortic valve, aorta and tight arterioles
An analogy, not a model: real preload is ventricular stretch, real afterload is the load during ejection.

The Frank–Starling curve

Frank–Starling curves: stroke volume against preload Three curves rise steeply at low filling and flatten at high filling. The highest curve is a stronger heart or lower afterload; the middle curve is normal; the lowest, flattest curve is a weak heart or high afterload. On the steep part of the normal curve, the same extra filling adds a lot of stroke volume; on the flat part it adds very little. stroke volume → preload: ventricular filling (end-diastolic volume) → stronger heart or lower afterload normal weak heart or high afterload A: big rise steep part: fluid helps B: hardly any rise flat part: fluid only raises pressures
Teaching illustration, not to scale. A and B get the same extra filling.
  • Preload is stretch, not a fluid bag or a CVP number. It is how full and stretched the ventricle is at the end of filling (end-diastolic volume). Venous return fills it.
  • Frank–Starling: within limits, a more stretched ventricle squeezes harder, so more in means more out, until the curve flattens.
  • Contractility is the strength of the muscle itself at any given stretch. Adrenaline and inotropes raise it; ischaemia, sepsis and severe acidosis can lower it.
  • Afterload is what the ventricle pushes against while ejecting: a narrow aortic valve, a stiff aorta and, above all, tight arterioles. At the bedside, SVR is the usual stand-in, but it is not the whole of afterload.
  • The weak heart is afterload-sensitive. On the lowest curve, lowering afterload can raise stroke volume more than adding fluid.
  • All three levers move the curve or the point on it. Fluid moves you along a curve; inotropes and afterload change which curve you are on.

Why it matters at the bedside

"Is this patient fluid responsive?" really means "Is this ventricle on the steep part of its curve?" You cannot see that from the CVP. You test it: give a small fluid challenge or raise the legs, and watch whether stroke volume clearly rises. That is exactly the kind of change a beat-by-beat stroke volume monitor is good at showing.

Check yourself

Is a CVP of 12 mmHg the same thing as "good preload"?

No. CVP is a pressure in the great veins; preload is ventricular stretch. A stiff or failing heart can have a high CVP and still be under-filled, or a normal CVP and be on the flat part.

On the flat part of the curve, what does more fluid do?

Little for stroke volume, but it raises filling pressures and can push fluid into the lungs and tissues.

A weak left ventricle faces a very high SVR. Which lever might help without more fluid?

Lowering afterload: it can move the heart to a higher curve and raise stroke volume.

Read more: OpenStax 19.4 Cardiac Physiology · StatPearls: Physiology, Frank Starling Law · Monnet et al., Prediction of fluid responsiveness (2016)

Lesson 5 · Flow and pressure

Pressure is not flow

Cardiac output is how much blood moves each minute; blood pressure is how hard it pushes, and it depends on both the flow and how tight the small arteries are.

A garden hose with a nozzle

Garden hose analogy A pump on the left is the heart; the litres it pushes out per minute are the cardiac output. A pressure gauge on the hose is the mean arterial pressure. The nozzle on the right is the arterioles: tightening it raises pressure and cuts flow. Pump = heart HR × SV Gauge = MAP pressure in the hose Nozzle = arterioles how tight = SVR flow = CO
Tighten the nozzle: pressure rises and flow falls. Open it: pressure falls unless the pump works harder.
  • Cardiac output CO = HR × SV, about 5 L/min in a resting adult. Indexed to body size: CI = CO / BSA, adult ≈ 2.5–4.0 L/min/m².
  • Worked example: 70 beats/min × 70 mL = 4.9 L/min; divided by a BSA of 1.8 m², CI ≈ 2.7 L/min/m².
  • Mean arterial pressure MAP ≈ DBP + (SBP − DBP) / 3: the average pressure pushing blood into the organs. It sits closer to the diastolic value, not halfway, because diastole lasts longer than systole.
  • Systemic vascular resistance SVR = 80 × (MAP − CVP) / CO, adult ≈ 900–1500 dyn·s·cm⁻⁵. It is set mostly by the arterioles, the body's nozzles.
  • Turn it round: MAP ≈ CO × SVR / 80 + CVP. Pressure is flow times resistance, so a normal MAP can hide a low flow.

Same pressure, very different flow

Mean arterial pressure against cardiac output for three levels of SVR Three straight lines rise from a CVP of 5 mmHg. The steepest is high SVR (2400), the middle is normal SVR (1000), the flattest is low SVR (600). A dashed line at a MAP of 70 mmHg meets the high-SVR line at a cardiac output of about 2.2 L/min and the normal line at about 5.2 L/min. 04080120 02468 cardiac output (L/min) MAP (mmHg) high SVR 2400 normal SVR 1000 low SVR 600 MAP 70 ≈ 2.2 L/min ≈ 5.2 L/min

Try it

CO5.3L/min
CI2.8L/min/m²
MAP84mmHg

Flow and pressure both in the typical adult range.

Teaching illustration. CVP is fixed at 5 mmHg and BSA at 1.9 m² (an average adult); the red dot is your patient.

Why it matters at the bedside

In early shock the body tightens its arterioles to defend pressure, so MAP looks fine while flow is already falling (see the blood-loss model on the Compare page). Pressure still matters: in septic shock the usual starting target is a MAP of at least 65 mmHg. But only a flow number tells you whether the pump is keeping up. On the monitor, SVR is calculated from the cuff pressure, the entered CVP and the cardiac output, so it is only as good as those inputs.

Check yourself

HR 100, SV 40 mL. What is the cardiac output?

4.0 L/min (100 × 40 mL = 4000 mL per minute).

Blood pressure 90/60. What is the MAP, roughly?

70 mmHg: 60 + (90 − 60) / 3.

MAP is normal and SVR is very high. Is flow necessarily normal?

No. Tight vessels can hold the pressure up while cardiac output is low. Look at a flow number.

Read more: OpenStax 20.2 Blood Flow, Blood Pressure, and Resistance · StatPearls: Physiology, Cardiac Output · Surviving Sepsis Campaign guidelines 2021

Lesson 6 · Heart and lungs together

Breathing in a box

Every breath changes the pressure inside the chest, and that changes how easily blood returns to the heart; on a ventilator, stroke volume rises and falls with each breath.

Same box, opposite pressures

Breathing on your own versus a ventilator breath Left: breathing on your own, the diaphragm moves down, pressure in the chest falls and blood is drawn back into the heart easily. Right: on a ventilator, air is pushed in, pressure in the chest rises and squeezes the great veins, so less blood returns to the right heart. Breathing on your own chest pressure ↓ blood drawn in On a ventilator chest pressure ↑ veins squeezed blue band = venous return to the right heart (wider = more)
Schematic. The box is the chest; the floor is the diaphragm.

Stroke volume, beat by beat, over two ventilator breaths

Stroke volume bars across two ventilator breaths Twelve beats across two ventilator breaths. In the under-filled patient, stroke volume rises early in each breath and falls a few beats later, a large swing. In the well-filled patient the bars are almost level. airwaypressure breath in breath in SV(mL) SVmax SVmin beats →

SVmax 80 mLSVmin 62 mLmean 72 mLSVV 25%

SVV = (SVmax − SVmin) / SVmean

Teaching illustration with made-up beats, not a recording.
  • Breathing on your own: chest pressure falls as you breathe in, which helps venous return to the right heart.
  • On a ventilator the pattern flips. Each breath raises chest pressure: it briefly pushes blood from the lungs into the left heart (stroke volume rises), but squeezes venous return to the right heart; a few beats later left-heart filling and stroke volume fall.
  • The swing is bigger on the steep part of the Starling curve (Lesson 4): an under-filled heart feels every change in filling.
  • Stroke volume variation (SVV) puts a number on that swing; adult ≈ 5–15%. Values roughly above 10–13% (with a grey zone) suggest the patient would respond to fluid.
Only under the right conditions. SVV is reliable only with controlled ventilation and no spontaneous breaths, sinus rhythm, a tidal volume of about 8 mL/kg or more, and a closed chest. It is not valid with spontaneous breathing, arrhythmia, low-tidal-volume ventilation or most neonatal ventilation, and right-heart failure can mislead it. Otherwise, use a passive leg raise in adults.

Why it matters at the bedside

A high SVV is a question, not an order: "this heart may be on the steep part of its curve." Fluid responsiveness is not the same as fluid need: most healthy people are fluid responsive. Check the conditions first, then decide whether the patient also needs more flow. Raising PEEP or airway pressures squeezes venous return further, which is one reason output can fall after a ventilator change.

Check yourself

Why is SVV bigger in an under-filled patient?

The heart is on the steep part of its Starling curve, so each breath's change in filling causes a big change in stroke volume.

A patient breathing on their own on CPAP has an SVV of 18%. Can you trust it?

No. Spontaneous breaths make SVV unreliable. Use a passive leg raise or a small fluid challenge with stroke volume monitoring instead.

SVmax 80 mL, SVmin 60 mL, mean 70 mL. What is the SVV?

About 29%: (80 − 60) / 70.

Read more: Monnet, Marik, Teboul. Prediction of fluid responsiveness: an update. Ann Intensive Care 2016 · SVV on the Technology page

Lesson 7 · Fluid in the chest

The chest conducts, and fluid conducts best

Fluid carries electric current far better than air or fat, so the more fluid the chest holds, the better it conducts; a small current along the chest can therefore sense both fluid and each beat.

Where fluid sits in the chest, and the path of the Electrical Cardiometry current Front view. Four places can hold fluid: A, blood in the heart and great vessels; B, water in the lungs; C, fluid in the pleural space at the lung base; D, oedema in the chest wall. Sensors 1 and 2 sit at the left base of the neck, sensors 3 and 4 at and below the lower left ribs. The current runs between sensors 1 and 4, along the line of the descending thoracic aorta. 1 2 3 4 A B C D currentpath L R
  • A
    Blood in the heart and great vessels, including the descending thoracic aorta (red line).
  • B
    Lung water: fluid in and around the air spaces, as in pulmonary oedema.
  • C
    Pleural fluid: an effusion collecting at the base of the lung.
  • D
    Chest wall: oedema in the skin and soft tissue.
Front view: the patient's left is on your right. Schematic positions; sensors as on the Technology page.
  • The baseline: thoracic fluid content (TFC). The steady conductivity of the chest rises with fluid anywhere in it: blood, lung water, pleural fluid, chest-wall oedema. Adult ≈ 25–35 1/kΩ.
  • It cannot tell which compartment. TFC is a conductivity index, not litres of lung water: a rising TFC can be more blood in the vessels, wetter lungs, an effusion or a swollen chest wall. Use it as a trend, alongside the examination and imaging.
  • What the current does not see: pressures. Electrical Cardiometry does not measure CVP or blood pressure; SVR needs a cuff pressure and an entered or assumed CVP.
  • On top of that baseline rides a tiny beat-by-beat change. Electrical Cardiometry models it on accelerating aortic flow; the descending thoracic aorta lies along the current's path.
  • Where the sensors go follows the anatomy: two at the left base of the neck and two at and below the lower left ribs, so the current runs the length of the thorax.

Why it matters at the bedside

Follow the TFC trend in heart failure, fluid therapy and weaning: a steady climb during fluid loading is a reason to stop and examine the lungs. Read it with caution in pleural effusions, chest drains, massive chest-wall oedema and marked obesity, where fluid outside the vessels changes the baseline.

Check yourself

TFC rises after 2 litres of fluid. Is the extra fluid in the vessels or the lungs?

TFC cannot say. It could be either, or both. Examine the patient, and look at the lungs with ultrasound or imaging if in doubt.

Why do the sensors sit at the neck and the lower ribs?

So the current runs along the thorax, past the heart and the descending thoracic aorta, where the beat-by-beat signal is modelled.

Read more: Sensor placement · Where the signal is modelled · When to be careful with the numbers

Review · Putting it together

Each number has an address

Three myths to unlearn, then a map: pick a parameter and see where in the body it is made.

Normal blood pressure means enough flow

Tight arterioles can hold MAP up while cardiac output is low (Lesson 5).

Preload is the fluid given, or the CVP

Preload is ventricular stretch at the end of filling. CVP is only a rough, indirect pressure clue (Lesson 4).

High SVV always means give fluid

Only with controlled ventilation, sinus rhythm and enough tidal volume, and only if the patient also needs more flow (Lesson 6).

Map of the heart, vessels and chest used to locate each parameter The chest outline with both lungs and the diaphragm. In the middle the heart with right atrium, right ventricle, left atrium and left ventricle, the sinoatrial node and conduction pathway, the aortic valve and the aorta arching to the patient's left and descending through the diaphragm. The superior vena cava enters the right atrium from above and the inferior vena cava from below. Below the diaphragm, the aorta divides into arterioles and capillaries, which drain into the veins. RA LA RV LV SVC IVC Aorta Lung Lung Diaphragm SA node Arterioles Capillaries Veins

Pick a parameter above, or press "Show on the map" on any card, to light up where it is made.

Schematic map, not to scale: the patient's right is on your left.
HR

Heart rate

the sinoatrial node in the right atrium, and the conduction system.

Each firing of the SA node is one beat. Faster rates raise output until filling time runs short.

bpm · adult ≈ 55–90
Preload

Preload

venous return through the venae cavae into the right atrium, and in the end the stretch of the left ventricle when it is full (end-diastolic volume).

More stretch, stronger squeeze, up to the flat part of the Frank–Starling curve. No single monitor number measures it directly.

tested by the SV response to a leg raise or fluid challenge
ICON · STR

Contractility

the muscle of the ventricles, above all the thick left-ventricular wall.

The strength of the squeeze at a given stretch. Monitor indices of it, such as ICON, also change with preload and afterload.

ICON adult ≈ 40–60 · STR ≈ 0.3–0.5
Afterload

Afterload

the aortic valve, the aorta and, mostly, the systemic arterioles.

What the left ventricle pushes against while ejecting. SVR is the usual bedside stand-in.

see SVR
SV / SI

Stroke volume

the left ventricle, ejecting through the aortic valve into the aorta.

Blood out per beat: end-diastolic minus end-systolic volume. The first number to look at in shock.

adult SV ≈ 60–130 mL · SI = SV / BSA
CO / CI

Cardiac output

the SA node (rate) times the left ventricle and aortic valve (volume per beat).

Blood pumped per minute: the flow that delivers oxygen.

CO = HR × SV · CI = CO / BSA · adult CI ≈ 2.5–4.0
MAP

Mean arterial pressure

the aorta and the arterial tree, held up by flow against arteriolar resistance.

The average pressure driving blood into the organs. Normal MAP does not prove normal flow.

MAP ≈ DBP + (SBP − DBP) / 3 · septic shock: start at ≥ 65 mmHg
CVP

Central venous pressure

the right atrium and the great veins next to it (superior and inferior vena cava).

Normally low. A rough pressure clue, a poor guide to fluid responsiveness. Without a central line it is entered by hand or left at a default.

mmHg · used in the SVR formula
SVR / SVRI

Systemic vascular resistance

the systemic arterioles, the body's adjustable nozzles.

Low in sepsis and anaphylaxis; high in hypovolaemic and cardiogenic shock. Calculated, so only as good as the BP and CVP entered.

SVR = 80 × (MAP − CVP) / CO · adult ≈ 900–1500 dyn·s·cm⁻⁵
SVV

Stroke volume variation

the heart–lung interaction: chest pressure from each ventilator breath acting on the great veins and the heart.

Bigger swing when the heart is on the steep part of its curve. Valid only with controlled ventilation and sinus rhythm.

SVV = (SVmax − SVmin) / SVmean · adult ≈ 5–15%
TFC

Thoracic fluid content

the whole chest: blood in the vessels, lung water, pleural fluid and the chest wall.

The baseline conductivity of the chest. It cannot tell the compartments apart, so follow its trend.

1/kΩ · adult ≈ 25–35

Adult reference values are typical ranges as on the Technology page; the monitor calculates its own range for each patient's age and size. Children and neonates have their own normal values.

From anatomy to the monitor

Structure, parameter, reading

The same chain, one row at a time: the place in the body, the physiology it makes, and what Electrical Cardiometry reports for it.

How each anatomical structure maps to a hemodynamic parameter and to an Electrical Cardiometry reading
StructureParameterWhat Electrical Cardiometry reports
SA node and conduction systemHeart rateHR, from an ECG-like signal between two of the sensors (not a diagnostic ECG)
Venae cavae, right atrium, left-ventricular fillingPreloadNo direct number: FTc, SVV under controlled ventilation, and the change in SV with a leg raise or fluid challenge
Ventricular muscleContractilityICON (load-dependent) and STR
Left ventricle → aortic valve → aortaStroke volume and outputSV / SI beat by beat; CO / CI = HR × SV
Systemic arteriolesResistance (afterload)SVR / SVRI, calculated from the entered blood pressure and CVP
Lungs and chest pressure with each ventilator breathHeart–lung interactionSVV (and VIC), valid only under controlled ventilation
Blood, lung water, pleura and chest wallFluid in the chestTFC, as a trend
Next

Next: how Electrical Cardiometry measures it

You know where the numbers live. The Technology page shows how four skin sensors turn the chest's conductivity into stroke volume, what every parameter on the screen means, and when to be careful with them.

Sources and further reading

Where this course comes from

Trusted, freely readable references. Links only: no text or figures are copied from them.

  1. OpenStax. Anatomy and Physiology 2e (Betts JG et al., 2022): 19.1 Heart Anatomy, 19.2 Cardiac Muscle and Electrical Activity, 19.3 Cardiac Cycle, 19.4 Cardiac Physiology, 20.2 Blood Flow, Blood Pressure, and Resistance. Free online textbook.
  2. National Heart, Lung, and Blood Institute (NIH). How the Heart Works: What the heart looks like, How blood flows through the heart, How the heart beats.
  3. StatPearls (NCBI Bookshelf): Delicce AV, Makaryus AN. Physiology, Frank Starling Law; Physiology, Cardiac Output. Peer-reviewed clinical review chapters, updated regularly.
  4. Monnet X, Marik PE, Teboul JL. Prediction of fluid responsiveness: an update. Ann Intensive Care 2016;6:111. doi:10.1186/s13613-016-0216-7 (open access).
  5. Martin ND, Codner P, Greene W, Brasel K, Michetti C; AAST Critical Care Committee. Contemporary hemodynamic monitoring, fluid responsiveness, volume optimization, and endpoints of resuscitation: an AAST critical care committee clinical consensus. Trauma Surg Acute Care Open 2020;5:e000411. doi:10.1136/tsaco-2019-000411 (open access).
  6. Evans L, et al. Surviving Sepsis Campaign: international guidelines for management of sepsis and septic shock 2021. Crit Care Med 2021;49:e1063–e1143. doi:10.1097/CCM.0000000000005337
  7. Nassef Academy, Electrical Cardiometry explained: sensor placement, parameter definitions, adult reference values and limits used on this page, summarised from Osypka Medical's published materials and the ICON instructions for use.