
Electrical Cardiometry™, explained
How four skin sensors turn the movement of blood in the aorta into a stroke volume, what every number on the monitor means, and where clinicians use it.
A tiny current
Four sensors on the left side, two at the base of the neck and two at and below the lower ribs, pass a 50 kHz current of at most 2 mA through the thorax and measure its conductivity.
Isolate the beat
Breathing and tissue change conductivity slowly. Filtering keeps the fast, heartbeat-synchronous part of the signal; the method models its peak rate of change on accelerating aortic flow.
Cells line up
The model behind the method: in diastole, red cells in the aorta lie randomly; when the aortic valve opens, pulsatile flow aligns them with the flow and conductivity rises sharply.
From speed to volume
How fast the alignment happens gives peak aortic acceleration and left-ventricular ejection time. A patented algorithm converts them into stroke volume, beat by beat.
Watch one heartbeat, slowed down
The aorta on the left and the signals on the right run on the same clock. Step between diastole and systole to see the cells turn, and conductivity rise as they line up.
Diastoleaortic valve closed · cells lie randomly
- B: valve opens · X: valve closes
- C: peak rate of change
Four sensors, one side, placed in minutes
All four sensors go on the patient's left side. The outer pair carries the small current; the inner pair measures the voltage it produces, from which the monitor reads the conductivity of the thorax.
- 1 · 2Base of the neck, left. Two sensors about 5 cm apart.
- 3 · 4Lower left thorax. One at the level of the xiphoid, one 10–15 cm below it.
- 1 + 4Outer pair: current. The 50 kHz current of at most 2 mA runs between them, through the thorax.
- 2 + 3Inner pair: voltage. Measures the voltage between them, from which the monitor reads the conductivity of the thorax.
Neonates and small children. In neonates and small children the outer two sensors can go on the forehead and the thigh.
What the monitor needs
Stroke volume and output need only the patient's weight, height, age and sex; SVR and oxygen delivery also need blood pressure, CVP, haemoglobin and SpO₂. The patient should lie still and quiet, and values appear within seconds.
From the aortic valve to the thoracic aorta
Breathing and tissue change conductivity slowly. Filtering keeps the fast, heartbeat-synchronous part of the signal; the method models its peak rate of change on accelerating aortic flow, from the valve through the ascending aorta and arch to the thoracic aorta, which runs along the path of the current.
How it differs from older thoracic bioimpedance: classic impedance cardiography read the beat-to-beat signal as a change in blood volume in the chest. Electrical Cardiometry reads it as a velocity signal from aligning red cells, which is meant to hold up better across body sizes, from preterm babies to obese patients.
Impedance cardiography
Reads the beat as a change in blood volume in the chest.
Electrical Cardiometry
Reads it as a velocity signal from aligning red cells.
The pump behind every number
On the left, the heart from the front, with the aortic arch and its three branches above it. On the right, the heart cut open in systole: the aortic valve is open and red cells stream into the aorta, lined up with the flow. That alignment is the change in conductivity the sensors pick up.
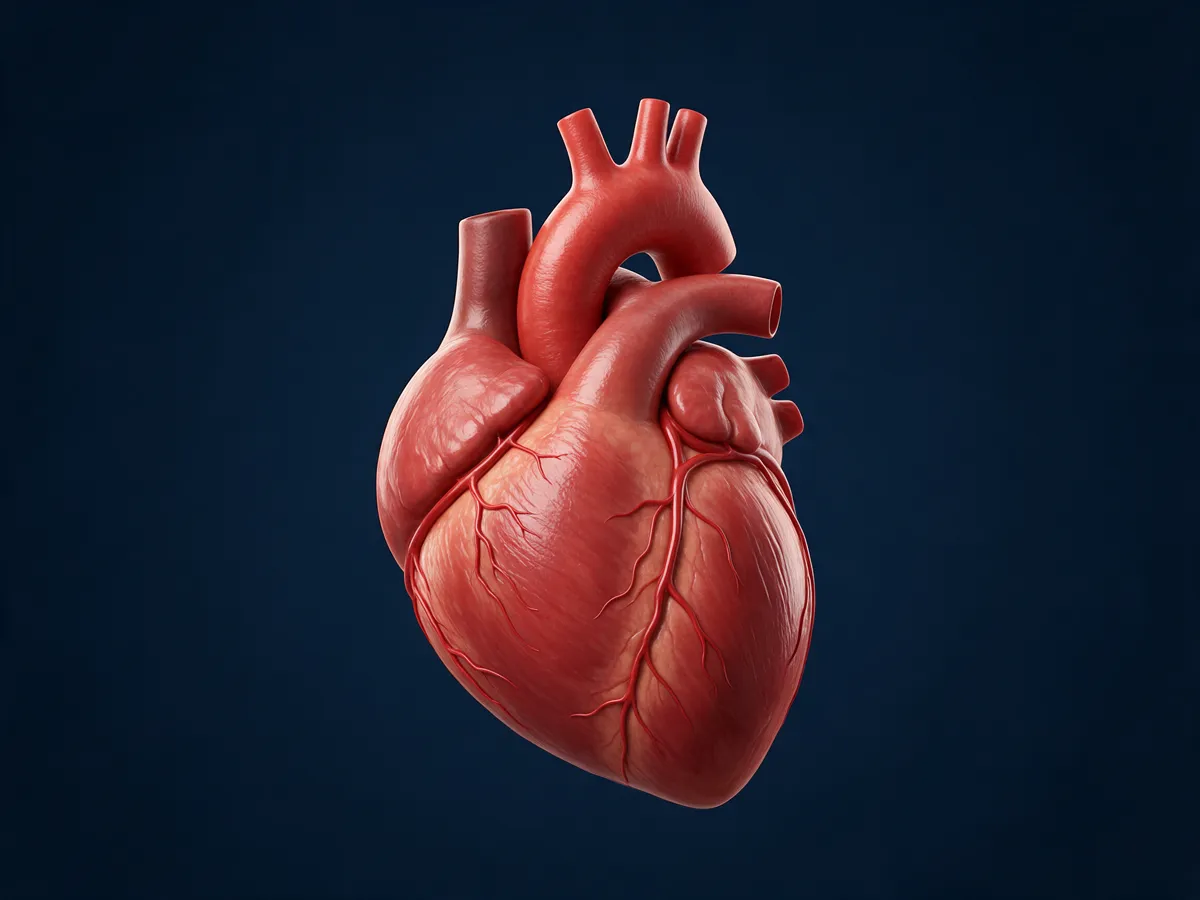
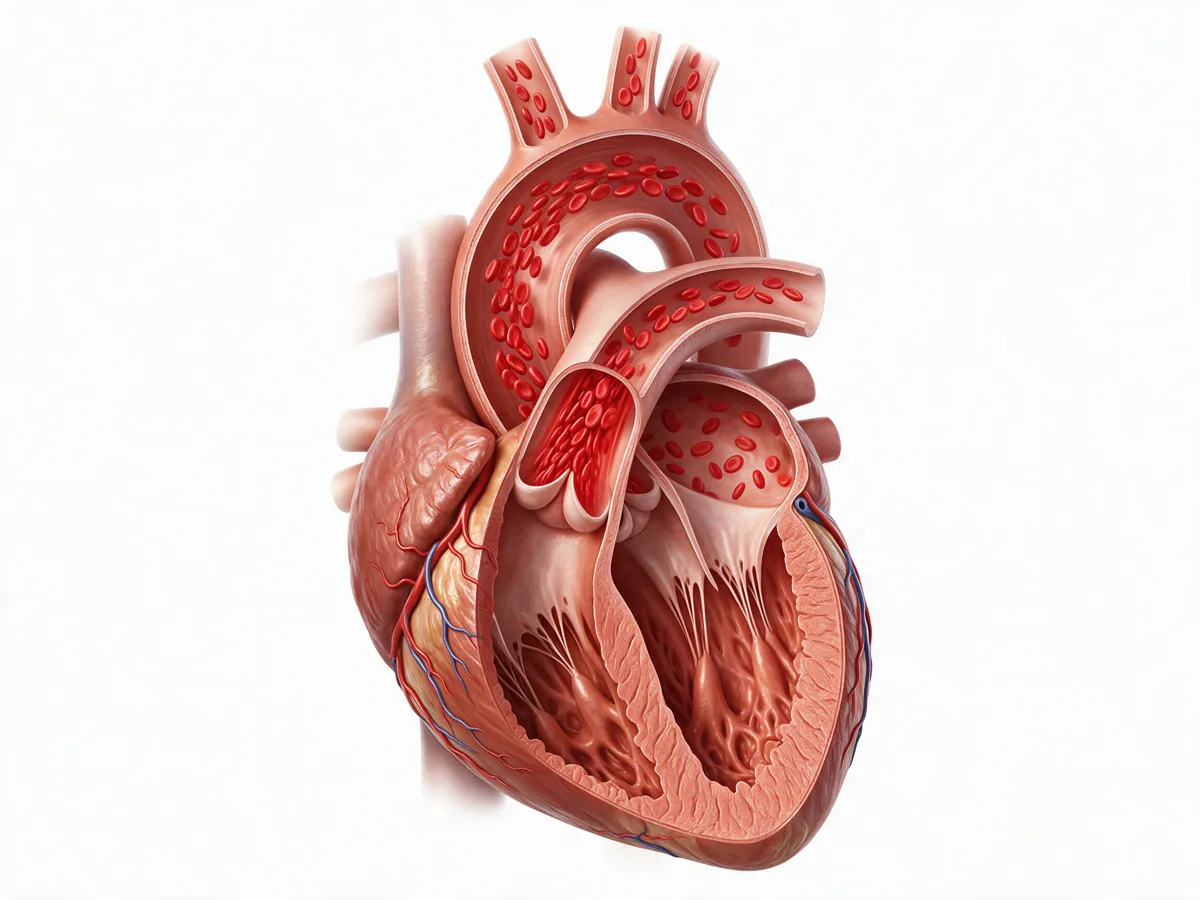
AI-generated teaching illustrations (Magnific), checked for the structures named here; artistic, not an anatomical reference.
Where the timing numbers come from
The monitor times every beat against the ECG. The points on the rate-of-change curve (dZ/dt) mark when the aortic valve opens and closes and when flow accelerates fastest; the intervals between them give several of the parameters below.
- R
- The ECG R wave: the electrical start of the beat that the monitor times everything against.
- B
- Aortic valve opening: blood starts to leave the ventricle and the dZ/dt curve turns upward.
- C
- The peak of dZ/dt, read as peak acceleration of aortic blood flow: the basis of ICON.
- X
- Aortic valve closure: the trough that ends ejection.
- PEP
- Pre-ejection period: from the start of the Q wave to valve opening (B).
- LVET
- Left-ventricular ejection time: from valve opening (B) to closure (X).
- STR
- Systolic time ratio, PEP/LVET.
- FTc
- Corrected flow time: ejection time corrected for heart rate, LVET / √RR interval.
In clinical use since 2002
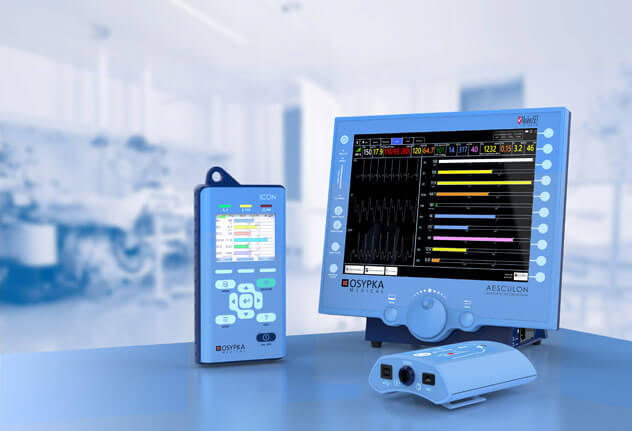
Osypka Medical launched the method in 2002 and lists close to 200 clinical studies, including comparisons with thermodilution, Fick and echocardiography. It is available on Osypka Medical's ICON® (hand-held) and ICONCORE® (PC-based) monitors.
Agreement for absolute values is moderate; changes over time are more reliable than single readings.
Trending holds best for routine changes (a leg raise, a fluid challenge, drug titration) and is weaker with large fluid shifts, vasoplegia after bypass, movement and shivering.
Electrical Cardiometry among the other methods
Every way of measuring cardiac output trades accuracy against invasiveness, cost and skill. Knowing the alternatives tells you when a non-invasive trend is enough and when it is not.
Pulmonary artery catheter
Thermodilution through a right-heart catheter. The historical reference, with pressures and mixed venous saturation, but invasive and with its own risks.
Transpulmonary thermodilution
Cold indicator through a central line, read at an arterial catheter; usually combined with pulse-contour analysis for continuous values.
Pulse-contour analysis
Stroke volume estimated from the arterial waveform, calibrated or not. Needs an arterial line; less reliable when vascular tone changes fast.
Oesophageal Doppler
Descending aortic flow from a probe in the oesophagus. Used in theatre for goal-directed fluid therapy; needs a sedated patient.
Echocardiography
Stroke volume from the LV outflow tract area and VTI, plus structure, valves and function. Operator-dependent and intermittent, but irreplaceable for the cause.
Electrical Cardiometry™
Four skin sensors, any age, continuous, no line. Moderate agreement for absolute values; strongest for trends and responses to treatment. Available on Osypka Medical's ICON® (hand-held) and ICONCORE® (PC-based) monitors.
Every parameter, in plain words
Indexed values (the ones ending in “I”) adjust for body size so patients of different size can be compared: flows are divided by body surface area (CI = CO / BSA, SI = SV / BSA), while resistance is multiplied by it (SVRI = SVR × BSA, or 80 × (MAP − CVP) / CI). Children and neonates still have their own normal ranges, and neonatal output is often expressed per kilogram. Reference values below are typical for an adult; the monitor calculates its own range for each patient's age and size, as a visual guide only.
Blood flowHow much blood is the heart moving?
Heart rate
Beats per minute, taken from an ECG-like signal between two of the sensors (not a diagnostic ECG). Together with stroke volume it sets cardiac output.
bpm · adult ≈ 55–90Stroke volume / stroke index
Blood ejected by the left ventricle with each beat. The first number to look at in shock.
mL · mL/m² · adult SV ≈ 60–130 mLCardiac output / cardiac index
Blood pumped per minute: heart rate × stroke volume. The flow that delivers oxygen.
L/min · L/min/m² · adult CI ≈ 2.5–4.0Vascular resistanceHow hard do the vessels push back?
Systemic vascular resistance
How hard the vessels push back. Calculated from mean arterial pressure, central venous pressure and cardiac output, so it is only as good as the entered or default CVP and the latest cuff pressure. Without a central line, CVP is entered by hand or left at a default, so SVR is an estimate: an unrecognised CVP of 18 mmHg, for example, makes it read too high. Low in sepsis; high in hypovolaemic and cardiogenic shock and in hypertension.
dyn·s·cm⁻⁵ · SVR = 80 × (MAP − CVP) / CO · adult ≈ 900–1500ContractilityHow strongly does the heart eject?
Index of contractility
Peak acceleration of aortic blood flow: how forcefully the ventricle ejects. It is load-dependent, changing with preload and afterload as well as contractility, and it can fall before blood pressure does.
no unit · adult ≈ 40–60Variation of index of contractility
Respiratory variation of the ICON value. Like SVV, it mostly reflects changes in filling with ventilation, not true changes in contractility.
%Systolic time ratio
Pre-ejection period divided by LV ejection time (PEP/LVET). A rough, qualitative pointer to ejection fraction: it rises as the ventricle weakens, but also with low preload and with conduction delay such as bundle-branch block or pacing.
ratio · adult ≈ 0.3–0.5Cardiac power index
The heart's hydraulic power output indexed to body size: MAP × CI / 451. A strong marker of prognosis in cardiogenic shock. (Some brochures call it the cardiac performance index.)
W/m²Fluid statusToo little fluid, or too much?
Thoracic fluid content
The baseline conductivity of the chest, which rises with fluid inside and outside the vessels, in the lungs and chest wall. It cannot separate intravascular volume, lung water, effusions, ascites and chest-wall oedema, so use it as a trend: follow its trend in heart failure, fluid therapy and weaning.
1/kΩ · adult ≈ 25–35Stroke volume variation
Swing in stroke volume with breathing. High values (roughly above 10–13%, with a grey zone) suggest fluid responsiveness, but only with controlled ventilation and no spontaneous breaths, sinus rhythm, a tidal volume of about 8 mL/kg or more, and a closed chest. Not valid with spontaneous breathing, arrhythmia, low-tidal-volume ventilation or most neonatal ventilation. In adults, use a passive leg raise instead; in children and neonates, leg-raise methods and thresholds are less established, so use a small fluid challenge with close reassessment and echocardiography.
% · ≈ 5–15Corrected flow time
Ejection time corrected for heart rate (LVET / √RR interval). Short values point to low preload or high afterload. Low specificity: not a fluid-responsiveness test on its own.
ms · ≈ 300–500Oxygen and pressureIs enough oxygen reaching the tissues, at what pressure?
Oxygen delivery
Oxygen carried to the tissues per minute, from cardiac output, haemoglobin and SpO₂ (entered or imported).
mL/min · mL/min/m²Mean arterial pressure
Calculated from the entered systolic and diastolic pressures.
mmHgBars show the typical adult range on a fixed scale, as a visual guide only. Heart icon: Health Icons, healthicons.org (MIT licence).
What “normal” looks like in newborns
Newborns pump about 200–270 mL of blood per kilogram per minute, three to four times the adult figure. Their unindexed vascular resistance looks enormous (around 10,000 dyn·s·cm⁻⁵) simply because the body is tiny; indexed values and age-specific ranges are what matter. Never compare unindexed values across ages. Measured by Electrical Cardiometry in these studies:
| Population | Value | Study |
|---|---|---|
| Healthy term newborns, day 1–2 | Left-ventricular output 534 ± 105 mL/min | Noori et al., 2012 |
| Low and very-low-birth-weight infants | Cardiac output 265 ± 49 mL/kg/min | Grollmuss and Gonzalez, 2014 |
| Preterm infants | Cardiac output about 200 mL/kg/min | Song et al., 2014 |
| Stable preterm infants | Stroke volume 3.1 ± 1.5 mL (echo 1.9 mL: EC reads higher) | Boet et al., 2016 |
| Very-low-birth-weight infants with a ductus (mean 929 g) | HR 163 ± 12 · CI 2.82 ± 0.56 L/min/m² · SVR about 10,500 dyn·s·cm⁻⁵ | Lien et al., Eur J Pediatr 2014 |
Values are study means and spreads, not cut-offs. Electrical Cardiometry tends to read higher than echocardiography in preterm infants, so follow each baby's own trend.
Four mechanisms of shock, four fingerprints
The same low blood pressure can come from an empty tank (hypovolemic), a weak pump (cardiogenic), open vessels (distributive: sepsis, anaphylaxis) or a blocked circuit (obstructive: tamponade, pulmonary embolism, tension pneumothorax). The flow numbers help tell them apart. Typical patterns, not rules: mixed pictures are common, and obstructive shock needs bedside imaging to confirm.
| Shock | SV | CO | HR | SVR | ICON | STR | TFC |
|---|---|---|---|---|---|---|---|
| Hypovolemic | ↓ | ↓ / = | ↑ | ↑ | ↓ / = | ↑ | ↓ |
| Cardiogenic | ↓ | ↓ | ↑ | = / ↑ | ↓ | ↑ | = / ↑ |
| Distributive: septic (after fluid) | = | ↑ | ↑ | ↓ | ↑ / ↓ | = | = |
| Distributive: anaphylactic | ↓ (early = / ↑) | ↓ (early = / ↑) | ↑ | ↓↓ | = | = | = / ↓ |
| Obstructive | ↓ | ↓ | ↑ | ↑ | = | = / ↑ | = |
↑ high · ↓ low · = normal. Adapted from Osypka Medical teaching material, which lists thoracic fluid in cardiogenic shock as normal or low; it is shown here as possibly raised because pulmonary congestion is common. Late septic shock can turn low-output when the heart tires. STR rises in hypovolaemia because ejection time shortens; septic ICON can be high (hyperdynamic) or low (septic cardiomyopathy); established anaphylaxis is a low-preload, low-flow state, although flow can be normal or high early on.
When to be careful with the numbers
Like every monitor, Electrical Cardiometry has situations where it should not be used or should be read with caution. In comparison studies, percentage errors against reference methods are often 30–40%, so it is not interchangeable with them for absolute values: trends and responses to treatment are more reliable than any single value. Trending holds best for routine changes (a leg raise, a fluid challenge, drug titration) and is weaker with large fluid shifts, vasoplegia after bypass, movement and shivering.
Not suitable
- Open chest: thoracotomy or open-heart surgery
- Ventricular assist devices or an artificial heart
- High-frequency ventilation
- Rate-responsive pacemakers that use impedance-based minute ventilation
- During external defibrillation
Read with caution
- Moderate to severe aortic regurgitation; intracardiac shunts and a large patent ductus
- Arrhythmia such as atrial fibrillation, and frequent ectopics (SVV in particular)
- Marked obesity, massive chest-wall oedema, pleural effusions or chest drains
- Intra-aortic balloon pump or ECMO
- Movement, talking, shivering; electrosurgery nearby
- Sensors moved off their standard positions
Summarised from the ICON instructions for use and Osypka training material. Always check the waveforms and the signal-quality indicator before acting on a value, and follow the manufacturer's current instructions for use.
From the NICU to the dialysis unit
Intensive care
Shock assessment, fluid and vasopressor guidance in adult and paediatric ICUs.
Neonatology
Studied in preterm and term neonates, where invasive lines carry the most risk. Best used for trends, paired with echocardiography.
Anaesthesia and surgery
Goal-directed therapy in liver transplant, neuro, orthopaedic and cardiac surgery.
Emergency and transport
Helping to distinguish cardiogenic, septic and hypovolemic shock early.
Cardiology
Heart failure, hypertension, the cath lab and pacemaker optimisation.
Obstetrics and nephrology
Preeclampsia and postpartum bleeding; dry weight in haemodialysis.
Application areas as listed by Osypka Medical. Indications and local registration vary by country.