Foundations
Medical studentsWhy blood pressure is not flow, and the three levers that set stroke volume.
- 1Flow is not pressure
- 2Preload, afterload, contractility
- 3Frank–Starling in one picture
- 4Indexing to body size
Learn to read cardiac output, stroke volume and vascular resistance, and to act on them at the bedside. A live simulator and interactive teaching cases today, short video lessons soon, with a clinician who works with these numbers every day.
Five tracks of four short lessons. Pick the one that matches your work.
Why blood pressure is not flow, and the three levers that set stroke volume.
Tell the four kinds of shock apart from their hemodynamic fingerprint.
Give fluid to those who will respond, and stop before it harms.
Children are not small adults: their own numbers, their own shock.
From four skin sensors to a number you can trust, and when not to.
Video lessons coming soon Each lesson is being recorded with Dr. Nassef. Until then, every track links to something you can practise today.
Change heart rate, preload, contractility and resistance, and see stroke volume, cardiac output and blood pressure respond on the Frank–Starling curve. Load a septic, hypovolemic or cardiogenic patient and try to fix them.
Illustrative monitor: sample numbers, not a live patient.
Each case gives you a patient, the hemodynamic profile and one decision. Choose, get the reasoning, and keep the teaching point.
High output, low resistance. Fluid, vasopressor or inotrope first?
Low output, high resistance, high thoracic fluid. What helps the heart?
Is the circulation coping? What the trend tells you that blood pressure can't.
Electrical Cardiometry™ follows the blood in the aorta beat by beat, without a catheter. Here is the idea in four steps.
Four sensors on the neck and left chest send a safe, high-frequency current and measure how easily it passes.
Between beats, red cells in the aorta lie randomly. When the valve opens, they align with the flow and conductivity rises.
How fast that change happens gives the peak acceleration of aortic blood and the ejection time.
From those, Osypka's patented algorithm estimates stroke volume and output; the same signal gives indices of contractility.

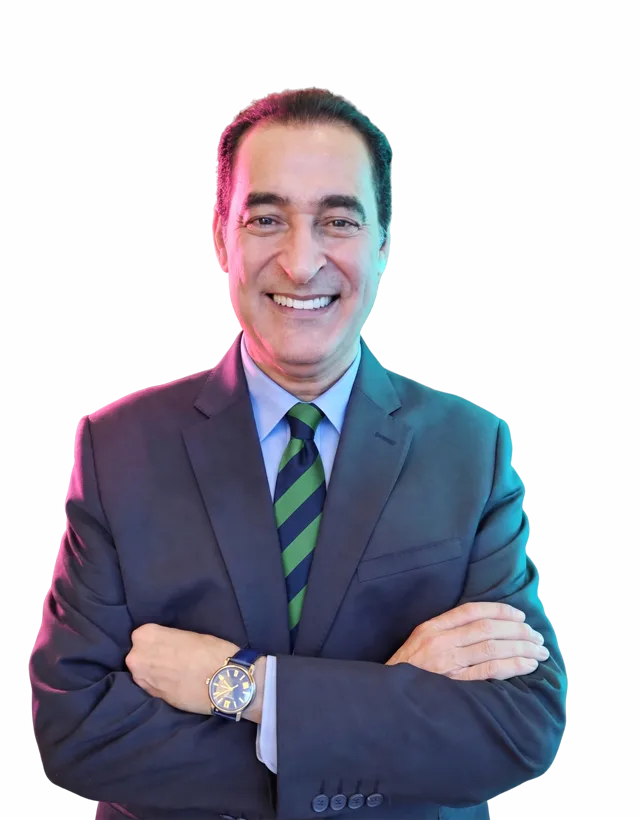
A physician and researcher (MD, PhD) at the Institute of Medicine, Chung Shan Medical University in Taiwan, who has spent his career making the circulation visible. He trains clinicians across Asia and the Middle East to monitor hemodynamics non-invasively and to act on what they see, and publishes on non-invasive monitoring in septic shock, hypertension and COPD.